lmSensors/Net-SNMP Sensor Readings
I try to monitor as many of the motherboard sensors as possible, since they can reveal a variety of hidden problems. Unfortunately, there is not a single universal source of motherboard sensor data available, so I have had to write multiple script templates that each pull sensor readings from device-specific sources, and then make them look and feel the same inside Cacti. This specific script template is for the lmSensors package that is typically included in Linux distributions, as exposed through Net-SNMP.
In this specific arrangement, Net-SNMP is configured to read lmSensors data through a local management interface, and then republishes the sensor readings through a Net-SNMP MIB. Specifically, Net-SNMP provides individual "pools" for fan, thermal, and voltage sensors, and a fourth pool for other/unknown sensors. Each pool is represented as an SNMP table, and contains entries that reflect the sensor index, sensor name, and current sensor reading. This model is reflected in this template as well, with sensors being grouped into fan, thermal and voltage groupings within Cacti for organizational purposes.
It's important to understand that Net-SNMP does not really "know" anything about the different sensor types, and instead uses string parsing techniques to group sensors into the approrpriate tables. Specifically, sensor names that contain the string "fan" are mapped to the fan pool, while sensor names that contain the string "temp" are mapped to thermal sensors, and sensor names that contain the letter "v" are mapped to voltage sensors. A fourth pool contains other/unknown sensors that Net-SNMP was unable to decipher. Thus, you must name your sensors appropriately in the lmSensors setup, or else some or all of your sensors will end up in the miscellaneous pool, where they will not be discovered or monitored.
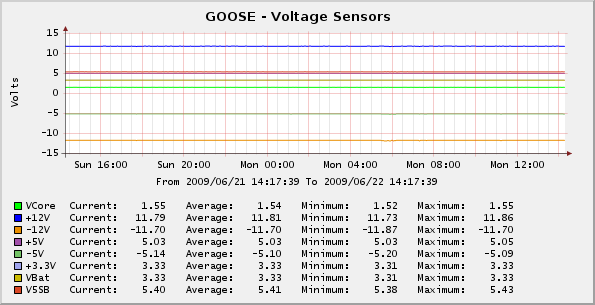
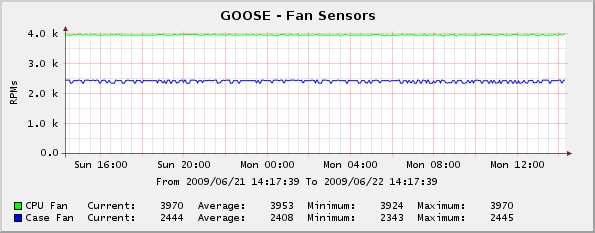
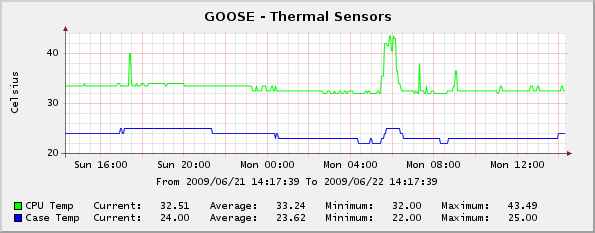
For illustration purposes, the graph in the figure at right shows the voltage sensors from one of my old SUSE Linux/Athlon servers: Additional graphs show two fan speed sensors, and two thermal sensors.
Installation
To use this script template, perform the following steps:
- Install and configure lmSensors on the target system, and ensure that each
of the desired sensors have names that will allow them to be discovered and
grouped by Net-SNMP correctly. In the sample below, the voltage sensor names
all contain the letter "V" while the fan sensor names all contain
the string
"Fan" and the thermal sensor names all contain the string "Temp".
If your system does not already have lmSensors installed, you may be able
to download a pre-made binary for your Linux distribution from an online package
repository, or in worst case scenarios you may need to compile the program
from source. However, note that lmSensors uses a large number of kernel modules
to read the various kinds of hardware sensors, and as such it is not usually
feasible to compile your own package.
[ root# ] sensors w83697hf-isa-0290 Adapter: ISA adapter VCore: +1.55 V (min = +1.71 V, max = +1.89 V) +3.3V: +3.33 V (min = +3.14 V, max = +3.47 V) +5V: +5.03 V (min = +4.76 V, max = +5.24 V) +12V: +11.80 V (min = +10.82 V, max = +13.19 V) -12V: -11.87 V (min = -13.18 V, max = -10.80 V) -5V: -5.15 V (min = -5.25 V, max = -4.75 V) V5SB: +5.40 V (min = +4.76 V, max = +5.24 V) VBat: +3.33 V (min = +2.40 V, max = +3.60 V) CPU Fan: 3970 RPM (min = 28125 RPM, div = 2) Case Fan: 2428 RPM (min = 28125 RPM, div = 4) Case Temp: +23°C (high = +60°C, hyst = +45°C) sensor = thermistor CPU Temp: +32.0°C (high = +70°C, hyst = +55°C) sensor = diode - Verify that the version of Net-SNMP on the target system was compiled with
the lmSensors extension by running
snmpd -Dmib_initand looking through the output for the "lmSensors" string (note that if you have enabled logging options for snmpd then the output will be sent there instead of stdout). The -Dmib_init parameter instructs the Net-SNMP daemon to enumerate the MIB extensions that it can load, and if the lmSensors MIB is not included in that list then you will need to obtain a version of NetSNMP that has been compiled with that feature. You may be able to download a pre-made binary for your Linux distribution from an online package repository, or in worst case scenarios you may need to compile the program from source. Verify that the sensors are being published through SNMP by using the snmpwalk utility to list all of the MIBs under the 1.3.6.1.4.1.2021.13.16 branch on the target device. - Download cacti-netsnmp-lmsensors.0.9.tar.gz to a temporary directory on the Cacti server machine.
- Expand the archive with the command
tar -xvzf cacti-netsnmp-lmsensors.0.9.tar.gz, and change to the cacti-netsnmp-lmsensors directory that is created. - Copy scripts/ss_netsnmp_lmsensors.php to the <cacti>/scripts/ directory.
- If the server is running Cacti 0.8.6, copy the XML files in resource/0.8.6/ to the <cacti>/resource/script_server/ directory, or if the server is running Cacti 0.8.7, copy the XML files in resource/0.8.7/ to the <cacti>/resource/script_server/ directory.
- Access the Cacti installation in a web browser, click on the "Import Templates" menu item on the left side of the Console screen, open the templates folder, and import the three data query templates. Cacti should automatically create the required data templates, data input methods, graph templates, and data queries.
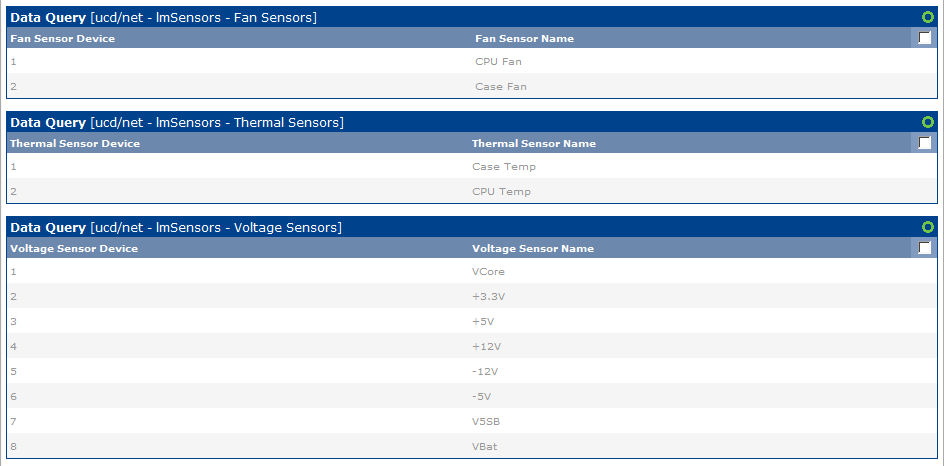
- Click on the "Data Queries" menu item on the left side of the Console screen and verify that a "ucd/net - lmSensors - Fan Sensors" data query is present. Click the name of the object and verify that Cacti was able to locate and read the XML resource file. Repeat this process for the Thermal and Voltage data queries.
- Click on the Devices menu item on the left side of the Console screen, select a *NIX device that is running Net-SNMP and lmSensors, and scroll down to the "Associated Data Queries" table at the bottom of the screen. Select "ucd/net - lmSensors - Fan Sensors" in the "Add Data Query" drop-down box, and click the "Add" button. Repeat this step for the Thermal and Voltage data queries.
- After the Device screen reloads, verify that the data queries added in step 9 above are present, and then click the "Create Graphs for this Host" link at the top of the page.
- Once the screen finishes loading, locate the "ucd/net - lmSensors - Fan Sensors" data query, which should be similar to the figure at right. Select the sensors that you want to monitor, and click the "Create" button at the bottom of the screen to include them in the process process. Repeat this process for the Thermal and Voltage data queries as desired.
Note: these files are intended to be used with Cacti 0.8.6 and 0.8.7 and PHP 5.2, and may not operate as expected with other versions.
Multi-Sensor Graphs
The process described above will result in each sensor device having its own graph. If you would like to consolidate multiple sensors of a specific type into a single graph, the tarfile includes graph templates that can be used to consolidate readings from multiple data sources, although some editing will likely be required. To use these graph templates, perform the following steps:
- Access the Cacti installation in a web browser, click on the "Import Templates" menu item on the left side of the Console screen, open the templates folder, and import the three "8x" graph templates. If you encounter the error "(GPRINT Preset) Exact Numbers" during the import process, you will need to take the following corrective action:
- If you are running an older version of Cacti 0.8.6, you may need to create the Exact Numbers GPRINT manually. To do so, click on the Graph Management menu item on the left side of the Console screen, and then click on the GPRINT Presets sub-menu item. Create a GPRINT Preset with the name of "Exact Numbers" and the Text value of "%8.0lf". After the GPRINT has been created, you can try to import the 8x graph templates again.
- Sometimes the graph items can become disassociated from the data source placeholders during the import process. To investigate if this is the problem, click on the "Graph Templates" menu item on the left side of the Console screen, open the 8x templates that caused the error to be reported, scroll down to the "Graph Item Inputs" section, and click on the top entry. The screen should reload with all of the graph items enumerated, and the top five graph items should have their selection boxes enabled (thereby indicating that they are associated with this entry). If the selection boxes for the top five items are not enabled, manually enable them and save the changes. Repeat this process for all of the graph items to ensure that all of the graph items are correctly associated with a data source.
- If you have exactly eight sensors of a specific type, you do not need to edit the associated graph template. However, if you have less than eight sensors of a specific type, you will need to create a copy of the associated graph template that refers to the exact number of sensors available. Similarly, if you have more than eight sensors of a specfic type, you will need to spread them across two or more consolidated graphs, and would need to create copies of the associated graph template that contain the necessary number of data sources that total the cumulative number of sensors available. To create copies of the graph template(s), click the "Graph Templates" menu item on the left side of the Console screen. For each copy, select the appropriate 8x graph template in the list, choose "Duplicate" in the drop-down list at the bottom of the screen, and then click the "Go" button. You will then need to edit each copy, delete any individual graph items that reference unused data sources, and assign a new name to the graph template.
- Once the appropriate-sized graph templates have been created, click the "Graph Management" menu item on the left side of the Console screen. Once the resulting screen finishes loading, click the "Add" button in the upper right corner to create a new consolidated graph.
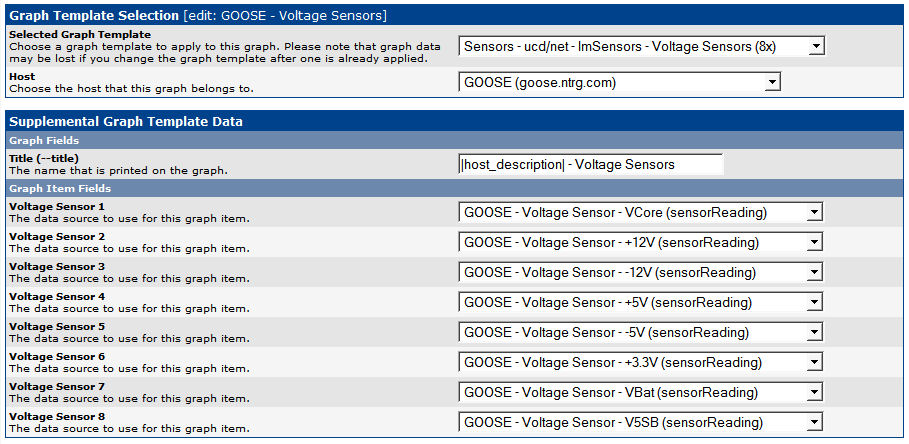
- Locate the appropriate graph template from the "Selected Graph Template" drop-down list, then choose the target device from the "Host" drop-down list, and then click the "Create" button to proceed.
- In the resulting screen, you will be presented with a list of the data source entries in the graph template, and given the opportunity to match each data source entry with a data source from the device. Each of the device-specific data sources were created when the individual sensors were selected for monitoring, so each sensor that is currently being monitored has its own discrete data source that can be incorporated into the consolidated graph. Choose the data sources that you would like to incorporate, and then click the "Save" button when finished.
- After the graph has been created, click on the "Graph Management" menu item on the left side of the Console screen, and verify that the graph you have just created is shown in the list. If you would like to use only the consolidated graph, you may also delete the individual sensor-specific graphs from this screen. If you do this, however, do not delete the data sources associated with the individual graphs, as those will still be needed for the consolidated graph.
Script Input and Output
In some cases you may want to execute the script file manually for debugging purposes. The parameters to the script use a fixed structure that is optimized for use with the Cacti poller, but also allows for human interaction. In particular, the script uses three parameter groups, with the exact structure depending on the SNMP version in use and the output that is desired.
The first parameter group provides an SNMP protocol "bundle" of the following values, separated by colon characters: In those cases where a value is unneeded (such as SNMP v3 authentication credentials for an SNMP v2 query), or where a default value is adequate (such as the SNMP port number), the value can be omitted.
- hostname: The domain name or IP address of the target device. This value is mandatory.
- version: The version of SNMP to use. The remaining parameter values will be verified against this value, and is mandatory.
- community: The SNMP community string to use. If version 1 or 2 was specified, the community string must be provided. If version 3 was specified, this value will be ignored.
- v3 username: Part of the credentials for SNMP v3 queries. If version 1 or 2 was specified, this value will be ignored.
- v3 password : Part of the credentials for SNMP v3 queries. If version 1 or 2 was specified, this value will be ignored.
- v3 authentication protocol : Part of the credentials for SNMP v3 queries. If version 1 or 2 was specified, this value will be ignored.
- v3 privilege password : Part of the credentials for SNMP v3 queries. If version 1 or 2 was specified, this value will be ignored.
- v3 privilige protocol : Part of the credentials for SNMP v3 queries. If version 1 or 2 was specified, this value will be ignored.
- v3 authentication context : Part of the credentials for SNMP v3 queries. If version 1 or 2 was specified, this value will be ignored.
- port number: The UDP port number for the SNMP daemon on the target device. If a value is not specified, the default value of "161" will be used.
- timeout: The number of seconds to wait for the SNMP query to be executed. If a value is not specified, the Cacti configuration will be read for a locally-defined default value.
Taken as a whole, a valid SNMP bundle for the localhost device using SNMP v2 with the community string of "public" on the default port number and a default timeout would be "localhost:2:public::::::::".
The next parameter identifies the sensor type for the queries. The sensor type must be specified as either "fan", "temperature" or "voltage". The sensor type is needed in order to locate the correct data, and is also used to normalize some types of response strings, and as such must always be specified.
The next parameter identifies the type of Cacti data that is being requested. Cacti uses "index" queries to enumerate all of the entries for a data query template, and then uses various kinds of "query" queries to obtain extended information about those entries (such as the full name of each indexed entry). Separately, the Cacti poller uses "get" queries to fetch the readings for each specific entry (again, keyed by index value). Note that he index and query operations are typically only performed when the device entry is being created or modified, and the get operations provide the actual readings to the poller. This script parameter must be one of those query types, with any remaining parameters providing any necessary supplemental data. Specifically the request parameters are one of the following:
- index: This request asks for a list of sensor device identifiers. No additional input data is needed. The response data is provided as a series of index values, with each sensor being enumerated on a separate response line.
- query <fieldname>: This request asks for the specified field data associated with each sensor device. The response data is provided as "index:data" pairs, where the index value is the primary device identifier, and the data value is the requested field data as available.
- get <fieldname> <sensor>: This request asks for the specified field data associated with the specified sensor device. The requested data is provided by itself with no other accompanying information.
The field names that can be used in "query" or "get" requests are as follows:
- sensordevice: The index value for the sensor(s).
- sensorname: The human-friendly name for the sensor(s).
- sensorreading: The current reading for the sensor(s). For example, "12" volts, or "2300" RPMs.
You must know the index value that has been assigned to a device before you can ask for details about that specific device. To do this, you can use the "query sensorname" request to get a list of sensors and their descriptions, and then use the "get <fieldname> <sensor>" request to get information about the desired sensor. The full command lines for these requests, using example data from above, are shown below:
$ php ss_netsnmp_lmsensors.php hostname:2:public:::::::: voltage query sensorname
1:VCore
2:+3.3V
3:+5V
4:+12V
5:-12V
6:-5V
7:V5SB
8:VBat

$ php ss_netsnmp_lmsensors.php hostname:2:public:::::::: voltage get sensorreading 1
1.536

Copyright © 2010-2017 Eric A. Hall.